
AI Startup Valuation: Why Revenue Multiples Separate From Capital Efficiency
By Lior Ronen | Founder, Finro Financial Consulting
In AI startup valuation, revenue multiples have basically become the headline number everyone looks at. They’re simple, they sound impressive, and they make it easy to compare one company to another.
But when you dig into actual data from hundreds of AI startups, things don’t line up the way most people expect. A high multiple doesn’t automatically mean the business is efficient, disciplined, or even performing well.
In the dataset of 565 AI companies across 15 niches, one pattern kept showing up. Revenue multiples often go up while capital efficiency goes in the opposite direction. Some of the “hottest” companies in the market are also the least efficient ones.
This gap between valuation and performance is turning into one of the biggest blind spots in how AI startups are judged. It influences how founders pitch their story, how investors compare companies, and what the market sees as strong fundamentals.
If you want a clearer picture of AI valuation in 2025, this mismatch between multiples and efficiency is where the real story starts.
AI valuation depends on where a company sits in the stack. Core AI earns higher multiples due to defensibility and model depth, while applied AI trades in tighter SaaS-like ranges driven by traction and efficiency. Using niche-specific comps and the right valuation methods creates more accurate, credible valuations for founders and investors.
- Looking beyond the headline multiple in AI startup valuation
- What the data shows across 565 AI companies?
- Niche-level patterns in AI multiples
- What founders and investors should do with these valuation patterns?
- How to apply these valuation patterns in practice?
- Summary
- Key Takeaways
- Answers to The Most Asked Questions
Looking beyond the headline multiple in AI startup valuation
In AI valuation conversations, EV/Revenue is usually the first number people pay attention to. It is quick, clean, and easy to compare across companies, which is why it shows up in almost every deck and investor discussion.
The problem is that EV/Revenue only tells you how expensive a company is relative to its top line. It does not tell you how efficiently the business runs or how much capital it consumed to get there. That becomes obvious as soon as you look at real examples in the dataset.
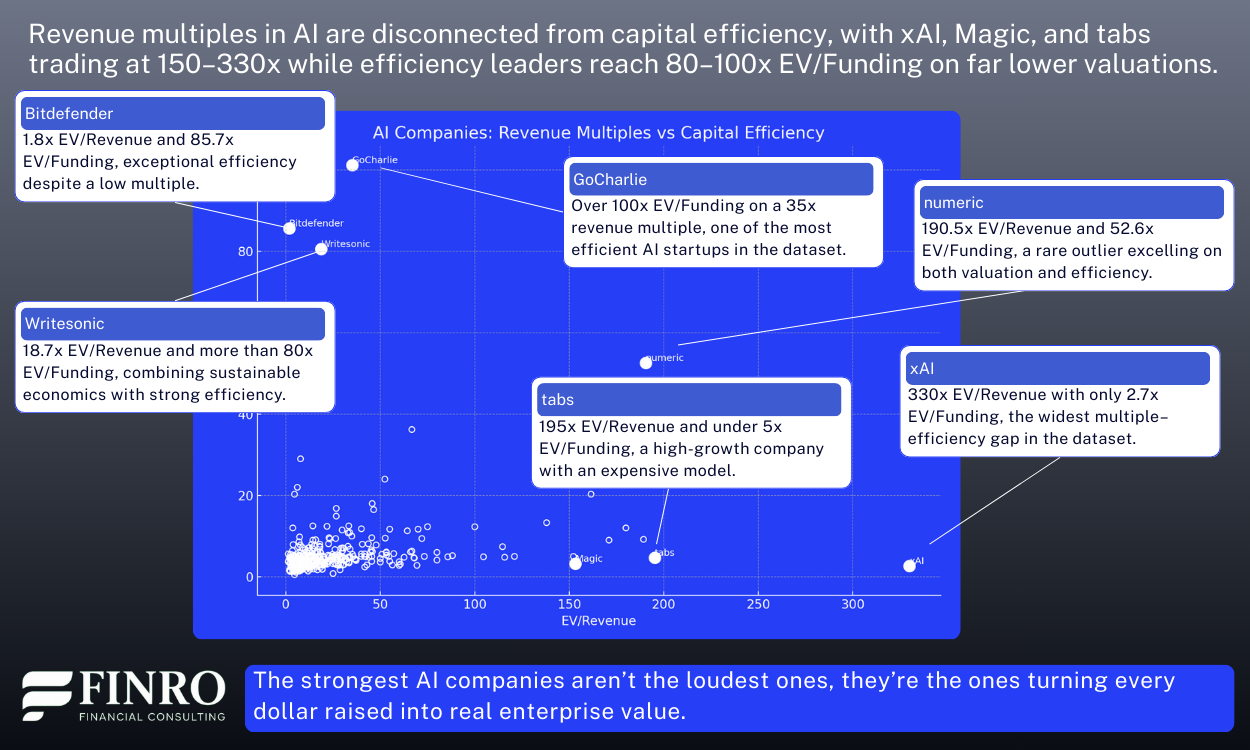
Take xAI, which trades at an extraordinary 330x EV/Revenue, the highest in the entire dataset. On paper, it looks unbeatable. But when you match that against efficiency, xAI creates only 2.7x enterprise value for every dollar of funding. Magic and tabs show the same pattern.
Magic trades at 153x revenue, tabs at 195x, yet both generate far lower enterprise value relative to the capital they raised. These are the kinds of companies that look incredible from a multiple standpoint but are expensive to build and expensive to scale.
On the other side, you find companies like GoCharlie, which barely shows up in the top-multiple rankings with 35x EV/Revenue, but delivers over 100x EV/Funding, making it one of the most efficient companies in the dataset. Writesonic and Bitdefender tell a similar story. Their multiples look average or even unremarkable at first glance, yet their capital efficiency is among the best in the entire AI landscape.
There are even rare cases like numeric, which combines a high multiple (190x EV/Revenue) with very strong efficiency (52x EV/Funding). These companies are the exception rather than the rule.
All of this highlights why relying on EV/Revenue alone can mislead both founders and investors. It rewards valuation heat without showing the cost required to generate it. EV/Funding brings discipline back into the picture.
When you look at both numbers together, a very different view of AI valuation emerges, one that reflects not just how expensive a company is, but how well it actually performs.
What the data shows across 565 AI companies?
When you look across the full dataset, the disconnect between revenue multiples and capital efficiency becomes structural rather than anecdotal. The two metrics simply don’t move in sync. Companies with triple-digit revenue multiples often sit side-by-side with others showing single-digit efficiency, and the pattern repeats across stages and niches.
One of the clearest examples comes from the top of the multiple distribution. Several infrastructure and LLM-adjacent companies cluster between 100x and 300x EV/Revenue, yet more than half of them fall below 5x EV/Funding. These are not small outliers; they represent some of the most widely discussed names in the market. Their valuations signal aggressive momentum, but the capital required to achieve those valuations is equally aggressive.
At the other end of the landscape, efficiency leaders often operate with far more modest revenue multiples. Many of the strongest operators in the dataset fall in the 10x to 25x EV/Revenue range while delivering 20x to 60x EV/Funding.
These companies tend to be in applied AI or vertical SaaS categories, tools that generate revenue early, avoid heavy compute spend, and scale without oversized burn. They rarely appear at the top of valuation league tables but consistently outperform on efficiency.
There is also a meaningful middle band of companies that neither dominate valuation headlines nor efficiency rankings. These businesses typically sit around 12x–18x EV/Revenue and 5x–10x EV/Funding, with steady but unremarkable scaling patterns.
They’re the ones building durable products, winning revenue without massive capital injections, and maintaining balanced unit economics. In a different funding environment, many of them would likely be the companies investors highlight first.
A useful case pattern appears in the growth-stage segment. Several Series B and Series C startups in your dataset generate $20–$60 million in revenue, trade at 15x–25x EV/Revenue, and have raised $150–$300 million.
On the surface, these companies’ multiples look healthy, but their EV/Funding ratios often land between 2x and 4x, signaling that the capital intensity of their model has outpaced the value created so far. It’s a recurring theme: valuation grows with scale, but efficiency doesn’t automatically follow.
Taken together, the scatter plot paints a landscape with four distinct regions instead of a single curve. High-multiple companies cluster tightly along the valuation axis, efficiency leaders rise along the vertical axis, and only a small handful land in the upper-right “strong on both metrics” area.
The insight is straightforward: in AI, valuation and efficiency come from different forces, and the companies that dominate one axis rarely dominate the other.
Niche-level patterns in AI multiples
The previous section showed how revenue multiples and capital efficiency spread across the entire dataset without following the same pattern. Once you break the market into individual niches, the picture becomes even sharper. Valuation behavior changes dramatically depending on where a startup sits in the AI stack.
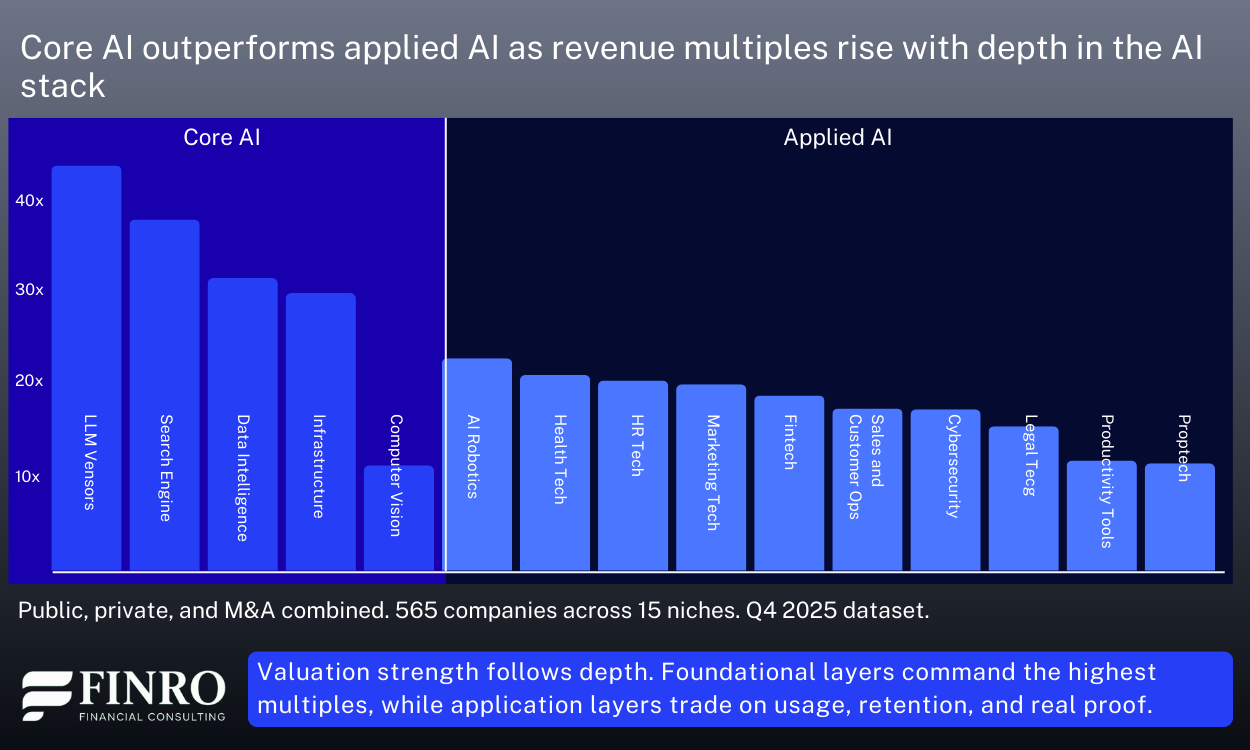
Core AI categories dominate the top end of the valuation range.
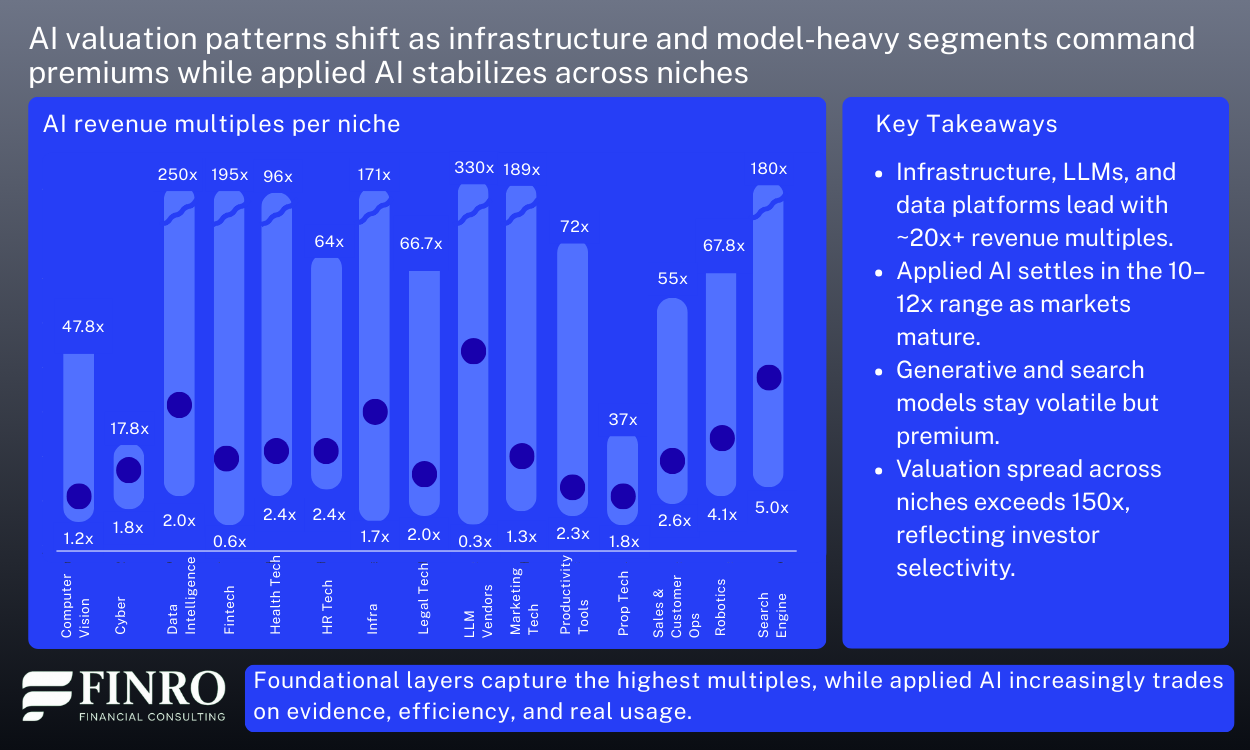
LLM vendors in your dataset show median revenue multiples near 40x, and some reach well above 100x. Search engines and data intelligence platforms follow closely, typically landing in the 25x to 35x range.
Infrastructure companies, including training and inference tooling, cluster around 20x to 30x, with several extreme outliers punching significantly higher. These segments attract premium valuations because they rely on technical depth, expensive compute, and defensibility that comes from owning foundational layers of the stack.
Applied AI settles into a very different band. Health Tech AI, HR Tech, Marketing Tech, Fintech AI, and Customer Ops platforms mostly trade between 9x and 12x revenue. The ranges are tight and stable compared to earlier years.
These companies scale more like SaaS businesses, and investors evaluate them primarily on traction, retention, and integration quality rather than on raw technical differentiation. They look more predictable on paper, and their multiples reflect that stability.
A few niches remain volatile. Generative tools, copilots, agents, and AI-enhanced search applications oscillate between 15x and 40x, depending on product maturity and defensibility.
They can spike quickly when a new product gains momentum, then normalize just as fast when competition intensifies or usage shifts. These segments sit between foundational depth and application breadth, and their valuation curves show that tension.
Across all niches, the spread between the highest and lowest multiples now exceeds 150x, which signals a market that prices AI as a collection of micro-economies rather than a single unified sector.
Foundational layers capture most of the valuation heat. Application layers trade closer to real-world revenue performance. This separation shows a maturing industry where niche dynamics matter as much as company-level performance.
With a clearer view of how multiples behave across AI niches, the next step is understanding why these patterns matter for founders, investors, and valuation decisions.
What founders and investors should do with these valuation patterns?
The previous section showed how valuation behavior shifts across the AI stack. Core AI earns higher premiums because it sits closest to models, data, and infrastructure. Applied AI settles into predictable ranges that look more like SaaS.
These differences are not just interesting patterns. They shape how founders should position themselves and how investors should evaluate opportunities. Once you understand your place in the stack, valuation strategy becomes much more targeted and credible.
Positioning your company correctly is the first step. Founders often weaken their fundraising position by pointing to comps that sit far above their niche. A company in a ten to twelve times revenue segment cannot justify a thirty or forty times multiple simply because an LLM vendor trades at that level. Valuation bands exist for a reason. LLM vendors now show median multiples near forty times revenue.
Data intelligence, search engines, and training platforms often trade in the twenty to thirty five times range. Applied AI niches like health tech, HR tech, marketing tech, and customer ops settle between nine and twelve times. Aligning your target range to the correct band signals that you understand how investors price risk in the segment you operate in.
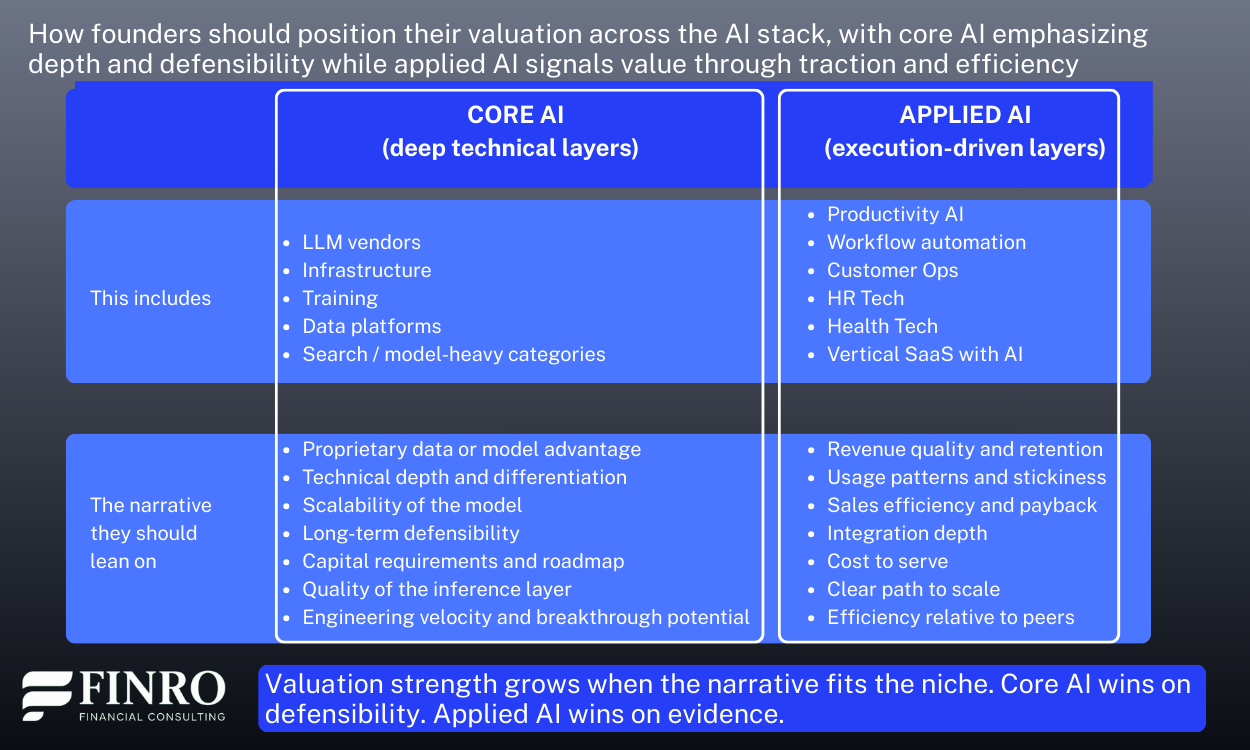
Crafting the right narrative follows naturally. Core AI founders must focus on defensibility, proprietary data, and technical differentiation. Investors want to know why your model will not be replaced, how it scales, and what advantage you hold as the ecosystem evolves.
Applied AI founders should lean into traction, retention, usage patterns, and cost to serve. These segments are judged less on breakthroughs and more on execution quality. Each niche has its own value drivers. When founders highlight the right ones, the valuation conversation becomes easier and more grounded.
Avoiding valuation mismatches is part of the discipline. When a company pitches itself using the wrong comps, it raises red flags around expectations and maturity. It suggests that the team does not understand how their market is priced.
The result is often a longer fundraising cycle or a valuation reset later in the process. A better approach is to anchor your valuation to the median for your niche, explain where you outperform, and note what might justify a premium. This builds credibility and reduces friction.
Investors also benefit from applying niche-specific thinking. Treating AI as a single category leads to mispricing. Core AI companies demand more capital, have deeper moats, and take longer to mature. The upside can be higher but the risk profile is different. Applied AI companies scale faster, but defensibility depends on customer stickiness, integration, and workflow adoption. Investors who separate these dynamics can price deals more accurately and avoid overpaying for categories driven by hype rather than fundamentals.
The final step is using these insights in day to day valuation work. For founders, this means mapping your product to the right layer of the stack, pulling comps that actually match your niche, and anchoring your target multiple to the correct range.
Then you can show why you might deserve a slight premium by pointing to efficiency, retention, or unique features. For investors, this means adjusting benchmarks by niche rather than applying a single “AI multiple,” assessing capital requirements by position in the stack, and using efficiency and traction as signals of quality in applied AI. For core AI, the most important signals come from defensibility, access to data, and long term differentiation.
At this point, the path is clear. Understanding the valuation structure and knowing how to use it in practice makes it easier to price companies, negotiate rounds, and build grounded expectations. The next section brings everything together by showing how these insights shape the actual valuation methods and the benchmarks that flow into the model.
How to apply these valuation patterns in practice
The previous sections showed how valuation behavior shifts across the AI stack. The practical challenge is using these patterns inside real valuation work. Many valuations break because they rely on generic AI benchmarks or stretch for multiples that do not match the market segment. Once the analysis is anchored to the right niche, the numbers become more accurate and the valuation narrative becomes far more credible.
A strong valuation begins with selecting the right peer group. Applied AI companies belong in the nine to twelve times revenue range, while core AI companies often sit in the twenty to forty times range and sometimes higher. Targeting the wrong band signals a misunderstanding of how the market prices risk.
Founders create stronger leverage when they anchor to the median for their niche and then explain why the company deserves a premium or a discount. In applied AI, higher multiples come from traction, usage patterns, and efficient growth. In core AI, they come from defensibility, model performance, and proprietary data. The valuation narrative holds up when it reflects the way investors actually evaluate the category.
Once positioning is clear, the next step is choosing the right valuation method. EV to Revenue is the dominant benchmark across AI, but it behaves differently depending on the business model.
In applied AI it acts more like traditional SaaS, where retention, revenue quality, and payback play a larger role in the multiple. In core AI, EBITDA is not meaningful early on, so EV to Funding becomes a practical way to assess how well the company converts investment into enterprise value. When the method matches the model, the output becomes a more realistic view of what the business is worth.
These principles become easier to apply with a reliable dataset. The dataset behind this article includes 565 five AI companies across fifteen niches and covers public, private, and M&A benchmarks. All metrics are standardized, outliers are cleaned, and each niche is structured according to how investors actually segment the market.
This removes guesswork and gives founders and investors a consistent baseline for comparing companies and building valuation models that reflect how the market prices AI today.
With this framework in place, the full dataset becomes the most reliable way to benchmark your own valuation. It covers over five hundred sixty companies across fifteen AI niches and reflects the actual pricing behavior investors use when evaluating core and applied AI.
If you want the complete revenue multiples, efficiency bands, and valuation ranges behind this analysis, you can download the full dataset and use the benchmarks to support your own valuation work with clarity and confidence.
Summary
AI valuation is no longer a single playbook. The market prices companies based on where they sit in the stack, how much depth they control, and how efficiently they turn capital into real traction.
Core AI earns platform-level premiums because it depends on models, data, and defensibility.
Applied AI trades closer to fundamentals because it wins through usage, retention, and execution. Once founders and investors anchor their valuation work to the right niche, choose the right peers, and apply the right method, the entire process becomes clearer and more grounded.
With accurate benchmarks and a consistent framework, it becomes much easier to price risk, negotiate rounds, and build models that reflect how the market values AI today.
Key Takeaways
AI valuation depends on a startup’s position in the stack, not a single market multiple.
Core AI earns higher premiums due to depth, defensibility, and model advantages.
Applied AI stabilizes near SaaS-like multiples driven by traction and efficiency.
Using niche-aligned comps creates realistic valuation targets and stronger fundraising narratives.
Valuation methods vary by niche, so founders must match metrics to their model.
Answers to The Most Asked Questions
-
AI startups are valued by comparing them to peers in the same niche, using revenue multiples, efficiency metrics, and defensibility signals instead of generic “AI” benchmarks.
-
Core AI earns higher premiums because it controls foundational layers like models, data, and infrastructure, which create strong defensibility and require more technical depth.
-
Applied AI companies typically trade around nine to twelve times revenue, similar to SaaS, with premiums tied to retention, usage, and efficient growth.
-
EV to Revenue is the primary benchmark, but efficiency, retention, cost to serve, and defensibility determine how far above or below the niche median a company should price.
-
Investors select comps by matching the startup to the correct AI niche, then using median revenue multiples and adjusting for efficiency, traction, and technical differentiation.