

API-as-a-Service Valuation Multiples: Mid-2025 Update
By Lior Ronen | Founder, Finro Financial Consulting
The API economy has quietly become the connective tissue of modern software: powering payments, identity, communications, search, and an exploding wave of AI services. Yet pricing these businesses isn’t straightforward: revenue can be usage-based, growth is non-linear, and category dynamics vary widely.
To bring signal to the noise, we mapped 286 companies across 12 niches, spanning public, private, and M&A comps. We normalize to EV/Revenue (with EV/Funding as a capital-efficiency lens), tag each company by niche and round, and refresh the dataset semi-annually with hotfixes on material events.
The result is a clear view of where multiples actually clear—from low-single-digit utilities to eye-watering AI APIs—and how they shift by category depth and funding stage.
This article distills the highlights: a market map of where APIs compete, a positioning matrix that links category scale to valuation, and a round-by-round curve that shows when investors pay for vision versus proof (Seed 12.3x → A 15.4x → B 28.9x → C 19.0x → D 35.1x → E+ 22.1x).
Along the way, we spotlight the patterns behind the numbers—why Payments can sustain premiums at scale, why Identity and Fraud earn scarcity premiums, and why AI & ML APIs dominate the upper-right quadrant.
If you want to run your own comps, the analyst-ready Excel (pivoted by niche, round, and deal type, with sources noted) is available to download for €79.90.
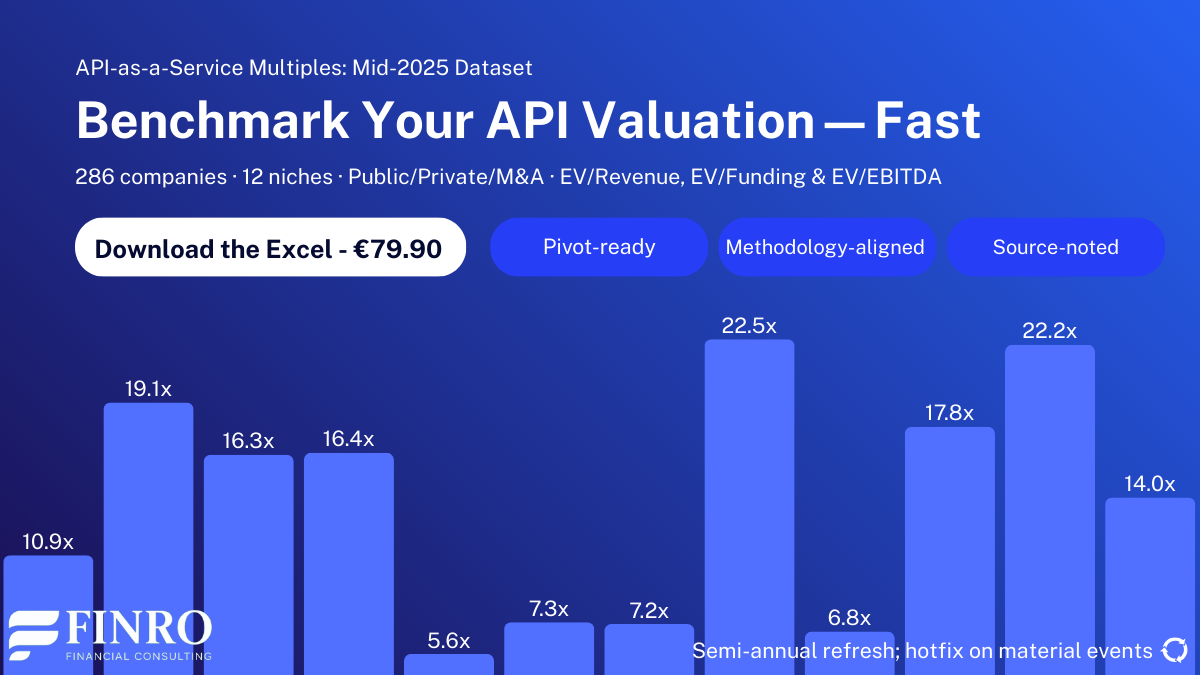
Across 286 companies in 12 niches, premiums accrue to mission critical APIs. AI and ML APIs, Maps and Geospatial, and Developer Infrastructure lead on EV to revenue, while Identity and Fraud capture a specialist premium. Marketing and content price more rationally amid heavier competition, and data enrichment and document processing trail unless paired with defensible workflows or embedded distribution. By stage, multiples peak in early growth and among de risked leaders, soften in the middle, and EV to funding stays in a tight band that signals capital efficiency. For deeper cuts by niche, round, and deal type, download the full dataset for €79.90.
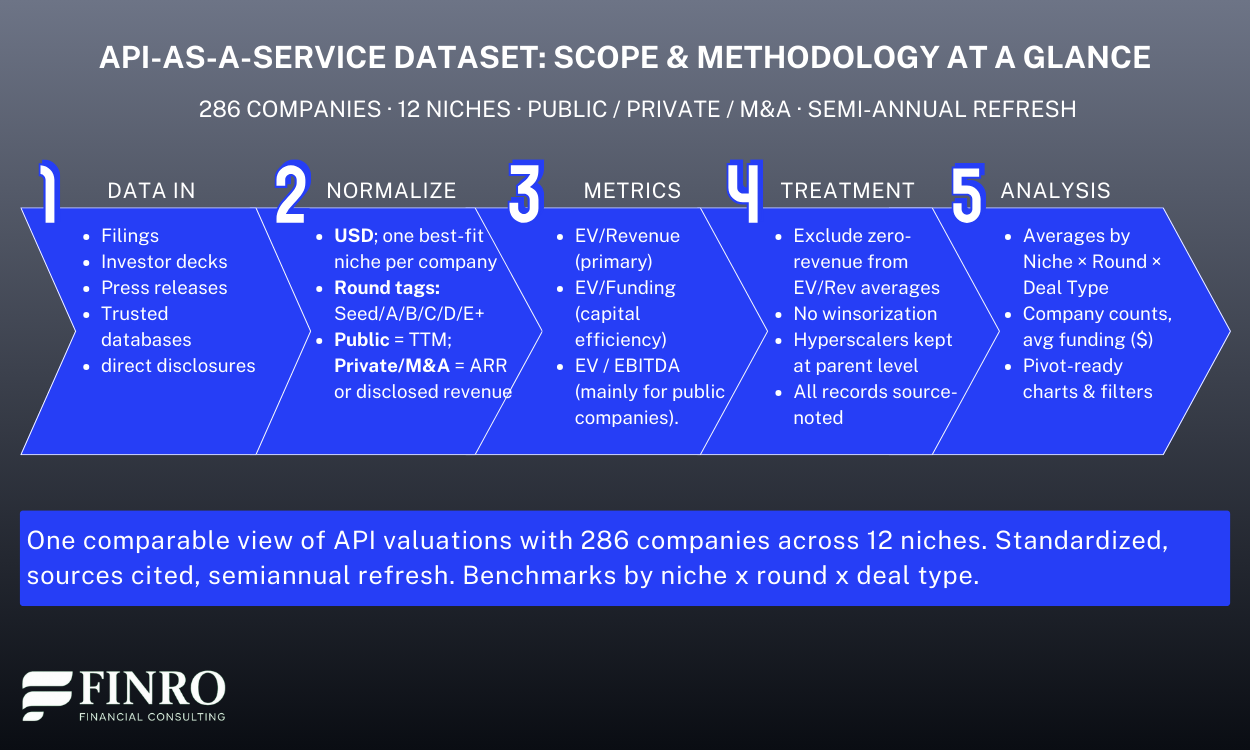
Scope & Methodology: what’s in the cut, and how we measure
We built this dataset to answer a practical question: what do API businesses actually trade for, by niche and stage?
The cut includes 286 companies across 12 API-as-a-Service niches, spanning public comps, private marks, and M&A prints.
Each record is tagged by niche and funding round so you can pivot by “what you are” and “where you are.”
Normalization. We standardize everything to USD and use EV/Revenue as the primary lens (TTM for public; ARR or disclosed revenue for private/M&A).
Where relevant, we also compute EV/Funding to show capital efficiency.
For public companies, EV = market cap + total debt − cash. For private companies, EV is derived from the latest primary round, secondary mark, or disclosed/estimated deal value.
Treatment rules (to keep the math honest).
We exclude zero-revenue companies from EV/Revenue averages (they’re still listed for completeness).
No winsorization: we show the real distribution, including outliers (e.g., frontier AI APIs).
Conglomerates (e.g., hyperscalers) are included at the parent level for consistency; they anchor the low-to-mid range while specialist API leaders stretch the top end.
Every value is source-noted; we refresh semi-annually with hotfixes on material events.
Benchmarks produced. The workbook outputs averages by niche × round × deal type, plus category company counts and a quick view of average funding. The charts in this article are generated directly from those pivots.
With the lens defined, let’s map the market itself, where APIs compete, how the 12 niches cluster into broader workstreams, and which categories combine scale with premium multiples.
Market map and where APIs compete
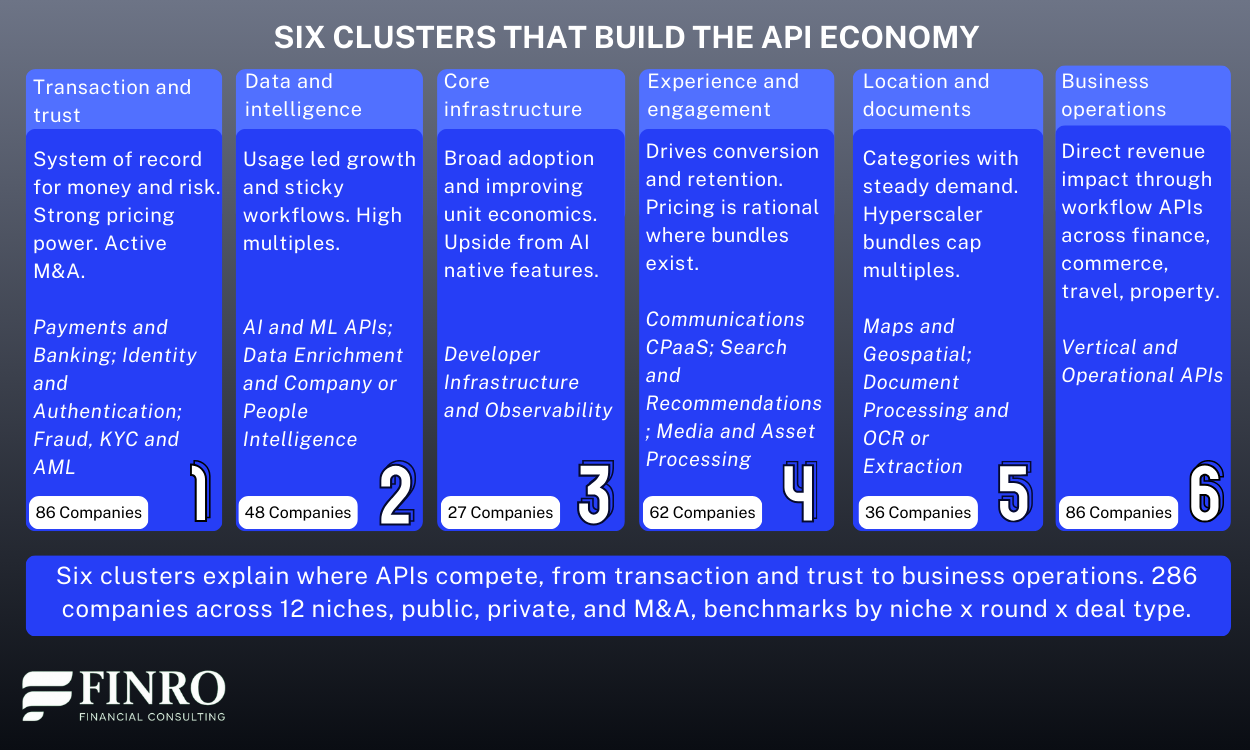
With scope and methodology set, we can look at the landscape itself. The dataset covers 286 companies across 12 niches, which cluster into a few clear workstreams that mirror how buyers source and adopt APIs.
Transaction and trust. Payments and banking, plus identity and fraud, form the system of record for money and risk. This cluster combines scale with durable pricing power. Payments clears broad ranges at scale, while connectivity assets and modern rails price higher. Identity and fraud show scarcity value that reflects regulatory pull and low tolerance for failure.
Data and intelligence. AI and ML APIs and data enrichment sit where developers go for intelligence on demand. This is the high multiple zone in our data, driven by usage based growth, sticky workflows, and clear product velocity. It is also where outliers pull the average upward, so we keep the full distribution visible in the workbook.
Core infrastructure. Developer infrastructure and observability supply the plumbing that makes modern stacks reliable. Adoption is wide and unit economics improve with volume. Multiples are healthy rather than extreme, with upside linked to AI native features and usage monetization.
Experience and engagement. Communications, search and recommendations, and media and asset processing power user facing experiences. These categories are deep and competitive. Pricing is rational where bundling and open source alternatives exist, and richer where engagement drives measurable revenue lift.
Location and documents. Maps and geospatial and document processing round out the stack. They show meaningful company counts and steady adoption with lower average multiples, a pattern consistent with hyperscaler bundles and established incumbents.
This map sets the stage for the key question that founders and CFOs ask most often. How does category scale relate to valuation. Next we connect company counts and averages in a single positioning matrix and highlight the categories that combine depth with premium pricing.
Category benchmarks: who earns a premium and why
With the market map in place, we can move from where APIs compete to how they are valued.
The dataset compares EV per Revenue and EV per Funding across all twelve niches, which lets us see where investors pay a premium and where pricing is more conservative.
Premium zone. AI and ML APIs sit at the top, followed by Developer Infrastructure and Observability. Both benefit from usage growth, deep embed in developer workflows, and clear upgrade paths that support expanding accounts.Payments and Banking can also price at a premium when a platform controls key connections or carries meaningful network effects.
Middle of the pack. Communications, Search and Recommendations, and Data Enrichment show healthy but more rational averages. Scale matters here. Vendors that pair a clear revenue lift with strong retention score higher. Where buyers can switch to open source or bundles from larger suites, multiples settle closer to the median.
Value zone with selective outliers. Maps and Geospatial and Document Processing show lower averages in our data, consistent with pressure from hyperscaler bundles and mature incumbents. That said, niche leaders with specialized coverage, high accuracy, or compliance features can still command strong terms, especially in regulated workflows.
Vertical and Operational APIs are mixed. Revenue impact is direct, which lifts pricing for tax, payroll, travel, and commerce connectivity. At the same time, categories with many near substitutes or heavy services attachment trade at moderate levels. Dispersion is wide, so category depth and customer mix matter as much as headline growth.
Capital efficiency is a second signal. EV per Funding separates durable platforms from capital intensive models. Developer infrastructure, identity, and parts of payments often show stronger efficiency. Media processing, basic messaging, and highly commoditized connectivity read lower unless there is clear differentiation.
These niche benchmarks set the baseline for positioning. Next we look at how revenue multiples change by funding round to see when the market pays for vision and when it rewards proof.

Stage benchmarks: where vision becomes proof
You have already seen how premiums concentrate in a few niches. The same pattern shows up across funding stages, with a different logic. Early on, investors pay for potential. By Seed and A, multiples are elevated relative to traditional software because teams are shipping product and showing first signs of pull. At B, pricing often stays high as distribution starts to work and net retention improves.
After that, the market asks for proof. Through C and into D, dispersion widens and the median steps down when revenue quality, margin shape, and sales efficiency are not yet consistent. The curve lifts again at the very late stages for a smaller set of leaders that have clear platform effects, strong renewal economics, and a credible path to free cash flow.
Two details matter for interpretation. First, variance by stage is meaningful. B and D tend to show the widest spread, driven by a few breakout outliers that raise the ceiling while the median remains disciplined. Second, sample sizes tighten in the very late stages, so treat those medians as directional context rather than precise guidance.
If you are using this to plan a raise, align your story to where the market puts weight. Before B, emphasize customer love, velocity, and a repeatable go to market motion. Around C and D, lead with unit economics, cohort durability, and sales efficiency. Beyond D, make predictability the headline and show the glide path to durable cash generation. Exact medians, ranges, and company counts by stage are available in the dataset.

Download the full dataset
Benchmark faster with clean, comparable numbers. For €79.90, The Excel gives you the complete view you need to price API businesses with confidence.
What you get
286 companies across 12 niches, public, private, and M&A.
EV to revenue and EV to funding, sliced by niche, stage, and deal type.
Summary tabs by niche and by round, plus ready pivots for quick cuts.
Source noted entries with links, definitions, and treatment notes.
Semi-annual refresh, with a hotfix on material events.
Who uses it
Founders and finance leads who need a defensible target multiple.
Investors and corp dev teams who need fast comps for a memo or IC.
Operators who want to track position against peers.
Summary
We mapped the API economy across 286 companies and 12 niches to show where pricing power lives and how it shifts by stage. The picture is clear. Premiums concentrate in AI and ML APIs, Maps and Geospatial, and Developer Infrastructure, while most niches sit mid pack and data enrichment and document processing form the value end.
The six cluster view explains why, from transaction and trust that carry strong pricing, to core infrastructure that scales across use cases, to experience layers that price rationally where bundles exist.
Stage dynamics add the second lens. EV to revenue is nonlinear, with early promise rewarded, proof demanded in the middle, and a later recovery for mature platforms. EV to funding stays in a tight five to six times band from Series A through later stages, which tells you capital efficiency is the anchor while revenue quality separates leaders.
Use this work as a playbook. Locate your niche and stage. Compare against the relevant cohort, not the entire set. Adjust for growth durability, margin structure, net revenue retention, and exposure to hyperscaler bundles or regulated industries. Decide where your story fits on the vision to proof spectrum, then set the target range and the path to earn it.
If you need the full view, the Excel has the complete set by niche, stage, and deal type with source noted entries and ready pivots. It is built to answer the next question, not just the first one.

Key Takeaways
Where premiums accrue by niche: Valuation premiums concentrate in Maps and AI APIs, with Identity and Developer Infrastructure strong, while Data and Media trail significantly.
The stage valuation curve: Multiples peak at Series A and B, compress through C and D, then recover at stages as leaders prove scale.
Capital efficiency by stage: EV to funding increases by stage, signaling improved capital efficiency as companies mature and demonstrate repeatability, durability, and margin structure.
Cluster patterns and pricing power: Premium clusters align with essential rails and regulated edges, notably Identity, Developer infrastructure, and Payments, while content utilities price lower.
Scope and how to go deeper: Analysis spans 286 companies across twelve niches with standardized sources and semiannual refresh; download the dataset for €79.90 to explore.
Answers to The Most Asked Questions
-
Maps and Geospatial, AI and ML APIs, Identity and Authentication lead on EV to revenue, reflecting mission critical use, strong switching costs, and platform effects.
-
Multiples peak at Series A and Series B, compress through Series C and Series D, then recover for mature platforms that prove scale, durability, and margin structure.
-
EV to funding generally rises with stage, signaling increasing capital efficiency as repeatable revenue, better unit economics, and defensibility emerge. Outliers reflect hype cycles or strategic control points.
-
Data enrichment and media utilities price lower due to intense competition, lower switching costs, and commoditization risk. Investors prioritize durable demand, integration depth, and clear margins when awarding premiums.
-
A standardized, source noted dataset covers 286 companies across twelve niches, including EV to revenue and EV to funding by stage. Download the full dataset for €79.90.

